Analysis of Wednesday's Trades:
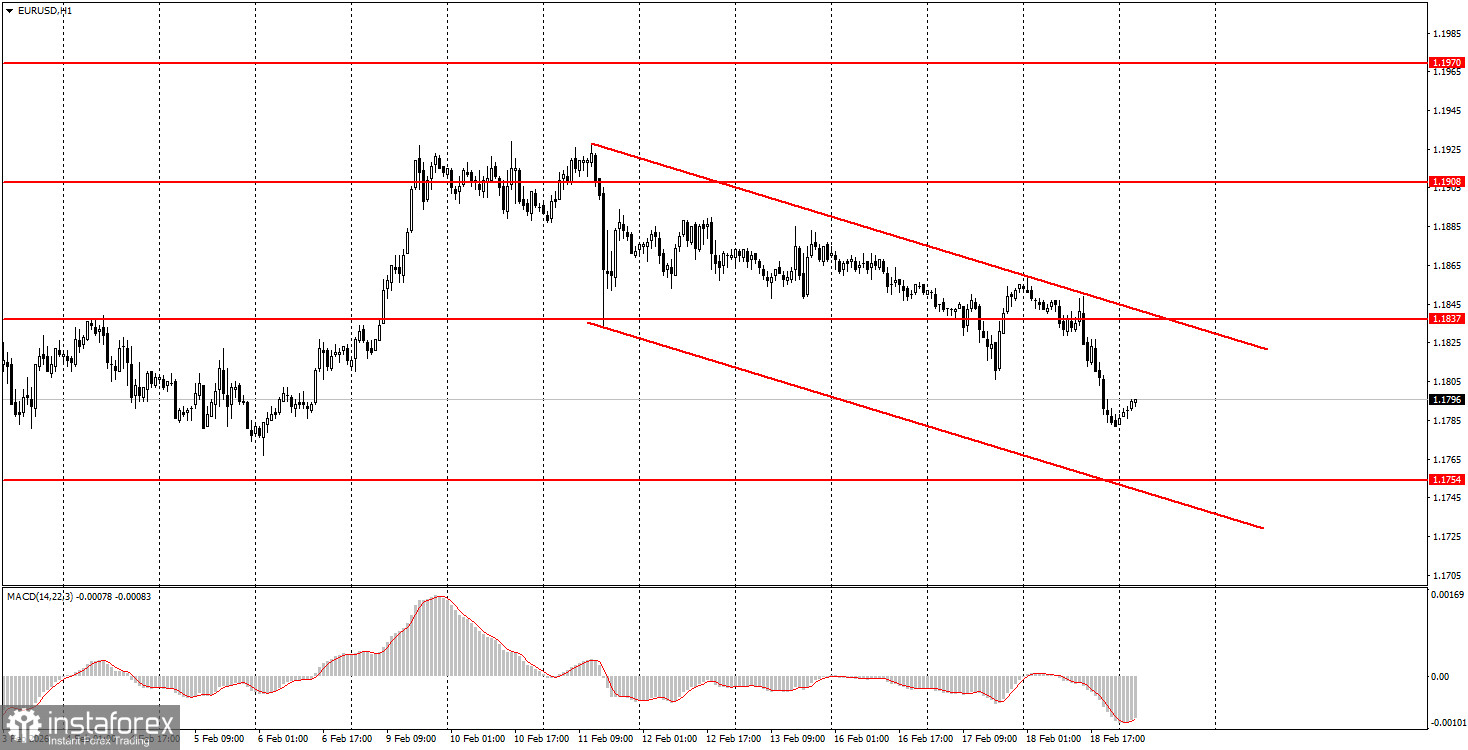
1H Chart of the EUR/USD Pair
The EUR/USD currency pair traded lower once again on Wednesday, with several factors contributing to the decline. No interesting reports were published in the Eurozone yesterday, leading to a stagnant price in the first half of the day. During the American trading session, three reports were released, each of which supported the US dollar. Although the reports themselves did not show staggering values and were not classified as "important," there was a formal reason to react to them. The most attention-grabbing report was on US durable goods orders. Despite a 1.4% decline in this category of orders in December, the market viewed this value positively, as forecasts indicated a 2% decline. This is usually how the dollar shows growth: any report has a minimally possible forecast set for it, and then almost any actual value exceeding that forecast helps the dollar.
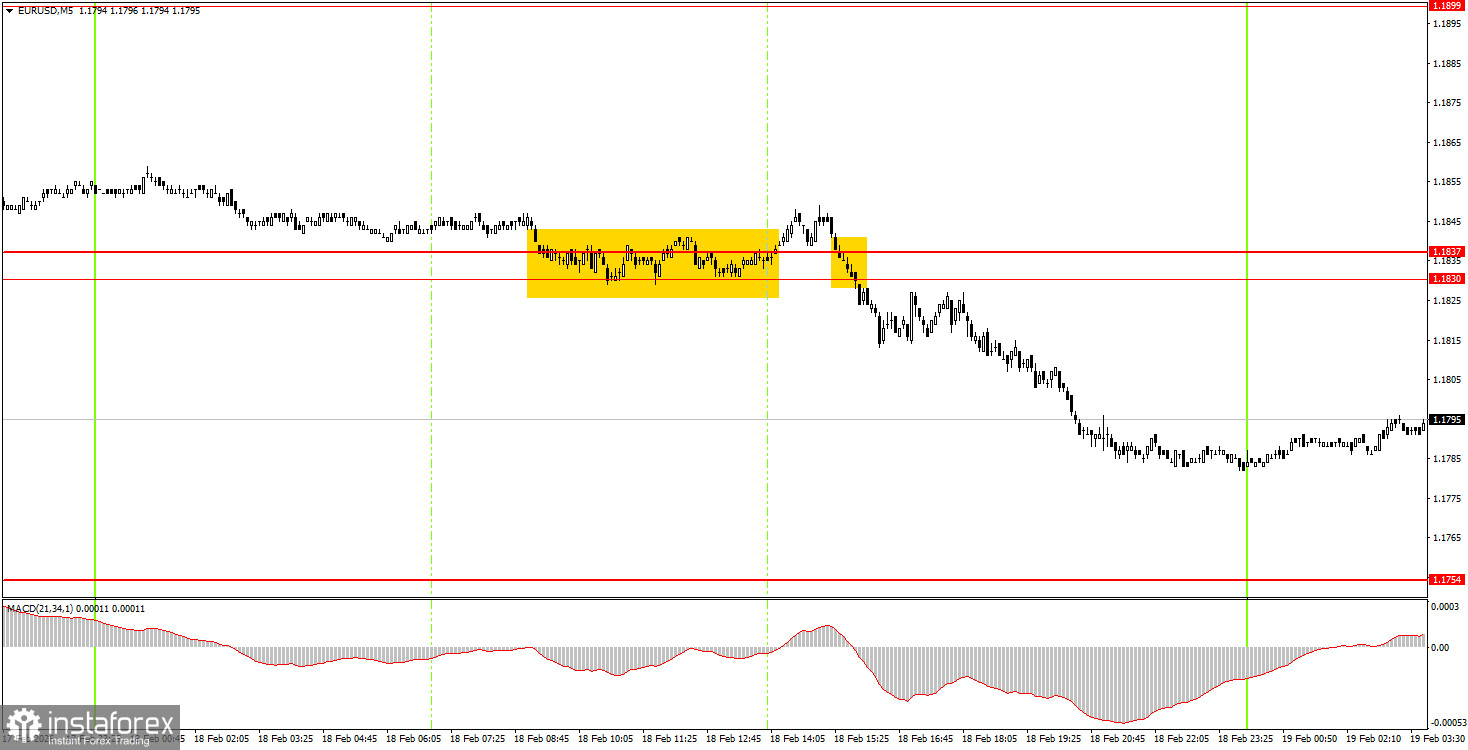
5M Chart of the EUR/USD Pair
On the 5-minute timeframe, two trading signals were formed on Wednesday. Unfortunately, the first signal proved false, and the price failed to move up by even 15 pips. However, the second sell signal in the area of 1.1830-1.1837 allowed beginner traders to recover losses from the first trade and end up in profit. By the end of the day, the pair moved in the desired direction by 40 pips.
How to Trade on Thursday:
A downward correction remains on the hourly timeframe, which may soon transform into an upward trend. At the beginning of 2026, the long-term upward trend resumed, so we are expecting new growth for the euro. The overall fundamental background remains very challenging for the US dollar, so we fully support further movement to the north.
On Thursday, beginner traders may consider new short positions if there is a rebound from the 1.1830-1.1837 area, targeting 1.1745-1.1754. A price rebound from the area of 1.1745-1.1754 would allow for long positions with a target of 1.1830-1.1837.
On the 5-minute timeframe, the following levels should be considered: 1.1455-1.1474, 1.1527-1.1531, 1.1550, 1.1584-1.1591, 1.1655-1.1666, 1.1745-1.1754, 1.1830-1.1837, 1.1899-1.1908, 1.1970-1.1988, 1.2044-1.2056, 1.2092-1.2104. Today, there are no important reports or events scheduled in the Eurozone, and in the US, only a minor report on unemployment claims will be released. Of course, a significant value with a strong deviation from the forecast could provoke a market reaction, as was the case yesterday. However, overall, this report is not considered important.
Main Rules of the Trading System:
- The strength of the signal is determined by the time it takes to form (rebound or breaking through the level). The shorter the time, the stronger the signal.
- If two or more trades were opened around a particular level based on false signals, all subsequent signals from that level should be ignored.
- In a flat market, any pair can generate numerous false signals or no signals at all. In any case, it is best to stop trading at the first signs of a flat.
- Trades are opened during the time period between the start of the European session and until the middle of the American session, after which all trades should be manually closed.
- On the hourly timeframe, signals from the MACD indicator should ideally be traded only when there is good volatility and a trend confirmed by a trend line or channel.
- If two levels are too close to each other (ranging from 5 to 20 pips), they should be considered as a support or resistance area.
- After moving 15 pips in the correct direction, it is advisable to set the Stop Loss to break-even.
What's on the Charts:
- Support and resistance levels are targets for opening buy or sell trades. Take Profit levels can be placed around them.
- Red lines indicate channels or trend lines that reflect the current trend and indicate the preferred direction for trading now.
- The MACD indicator (14,22,3) – the histogram and signal line – serves as a supplementary indicator that can also be used as a source of signals.
- Important speeches and reports (always found in the news calendar) can significantly influence the movement of the currency pair. Therefore, during their release, trading should be conducted with maximum caution, or it is advised to exit the market to avoid a sharp price reversal against the preceding movement.
- Beginners trading in the Forex market should remember that not every trade can be profitable. Developing a clear strategy and practicing sound money management are the keys to long-term trading success.