Bitcoin continues to form a new wave of a descending trend. After a sell signal was generated on the daily timeframe, at least two sell signals were formed on the 4-hour timeframe. The price has formed "bearish" Fair Value Gaps (FVG) twice and has reacted to them on both occasions. Thus, even on the lower timeframe, a downward movement continues, with no signs of its completion.
On the daily timeframe, the cryptocurrency continues to drop below the ascending trend line, which also serves as a liquidity pool. If we consider this trend line as a classic trend line, the price has breached it; therefore, according to technical analysis principles, the trend has changed to a downward one. If we view this trend line as a liquidity pool, the price had to drop below it to "collect" stop losses from traders and pending sell orders. As of now, there are no signs that Bitcoin's decline is concluding, so we expect further drops targeting $70,800.
The fundamental backdrop continues to exert no influence on the cryptocurrency market. This evening, the results of the Fed's meeting will be announced, and many experts continue to discuss Bitcoin's potential rise if the regulator continues to ease monetary policy. We believe the factor of a lower key interest rate in the US has been priced in since 2022, when inflation began to slow from its peak levels, and the market started to anticipate a softening of the Fed's policies. In our view, a downward trend is forming and will continue to form, unlikely to conclude within a few months. All "bullish" factors have been accounted for by the market.
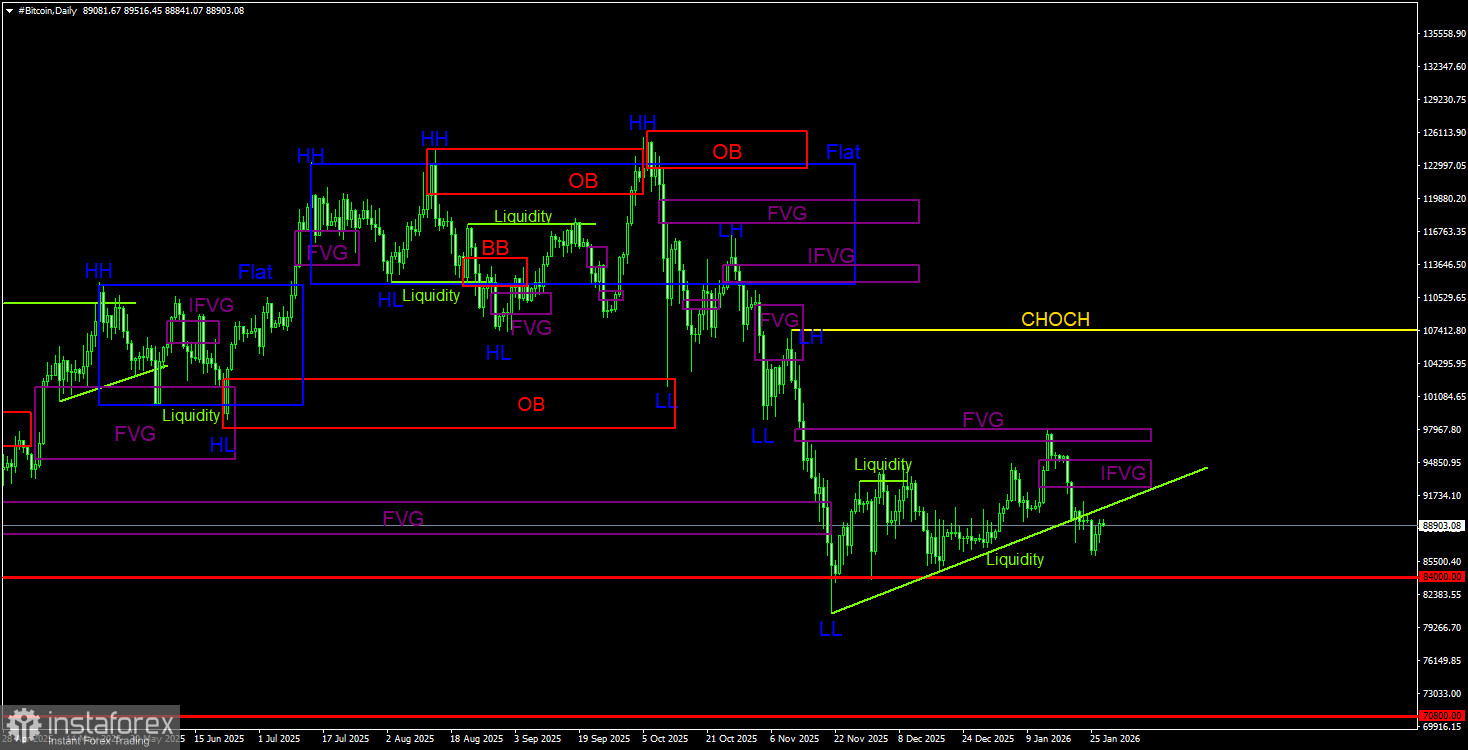
Overall Picture for BTC/USD on 1D
On the daily timeframe, Bitcoin continues to form a downward trend, and the correction may already be over. The trend structure is identified as bearish, and the CHOCH (Change of Character) line is currently at the level of $107,300. Only above this level can we conclude that the downward trend has ended. In 2026, Bitcoin might fall as low as $60,000, from where its last ascent began. Bitcoin received a significant reaction to the "bearish" FVG; a trading signal has formed, confirmation has been obtained, and the decline has commenced. The target for this new wave of downward movement may be $70,800, aligning with the 50.0% Fibonacci level. The "bullish" FVG has transformed into a "bearish" IFVG, which is now a new area of interest (POI) for sales.
Overall Picture for BTC/USD on 4H
On the 4-hour timeframe, the price has exited the sideways channel it spent 1.5 months in. However, Bitcoin's growth was short-lived, as the bearish FVG on the daily timeframe halted its upward movement. The upward structure on the 4-hour timeframe has been broken; over the past few days, two bearish FVGs have formed, each triggering a price reaction. Considering the situation on the daily timeframe, we anticipate that the decline will continue, and all the nearest bearish patterns can be used to open new short positions. If bullish patterns begin to form, the decline will be put on pause, but we remind traders that any rise in Bitcoin now is inherently a correction.
Trading Recommendations for BTC/USD:
Bitcoin continues to form a full-fledged downward trend. We expect a decline to $70,800 (the 50.0% Fibonacci level from a three-year upward trend) in the near future. New areas of interest for sales on the daily timeframe include the bearish IFVG located in the range of $92,500 – $95,000. The price may return to this pattern and then initiate a further decline. On the 4-hour timeframe, there are currently no unaccounted-for bearish patterns, so new short positions will only be possible in the $92,500–$95,000 range.
Explanations for the Illustrations:
- CHOCH – change in trend structure.
- Liquidity – Stop Loss orders by traders that market makers use to build their positions.
- FVG – Fair Value Gap. The price passes through such areas very quickly, indicating a complete absence of one side in the market. Subsequently, the price tends to return and react to such areas.
- IFVG – Inverted Fair Value Gap. After returning to such an area, the price does not react to it and pierces it impulsively, then tests it from the other side.
- OB – Order Block. A candle on which the market maker opened a position to grab liquidity for forming their own position in the opposite direction.