The EUR/USD currency pair continued to trade in a "zig-zag" and "fence" pattern on Wednesday. As a reminder, we will not discuss the outcomes of the FOMC meeting or any subsequent movements in this article. The reason is straightforward: we believe that right after the results are announced, the market trades on emotion. It often happens that the price initially moves in one direction, only to return to its starting position by morning. We even consider that all movements following the FOMC meeting should not be factored into technical analysis. Thus, it's better to wait for the market's passions to calm before drawing conclusions about the decisions made and how the market reacted.
Aside from the FOMC meeting, there wasn't much to analyze from yesterday. The EUR/USD pair continued to gently slide, with minimal volatility. Therefore, we assume the FOMC meeting will not change anything. We acknowledge that the market is anticipating the verdict from the U.S. central bank, but what can that verdict be if the market has been confident in a rate cut for several weeks? Additionally, Jerome Powell is unlikely to provide clear forecasts for monetary policy next year.
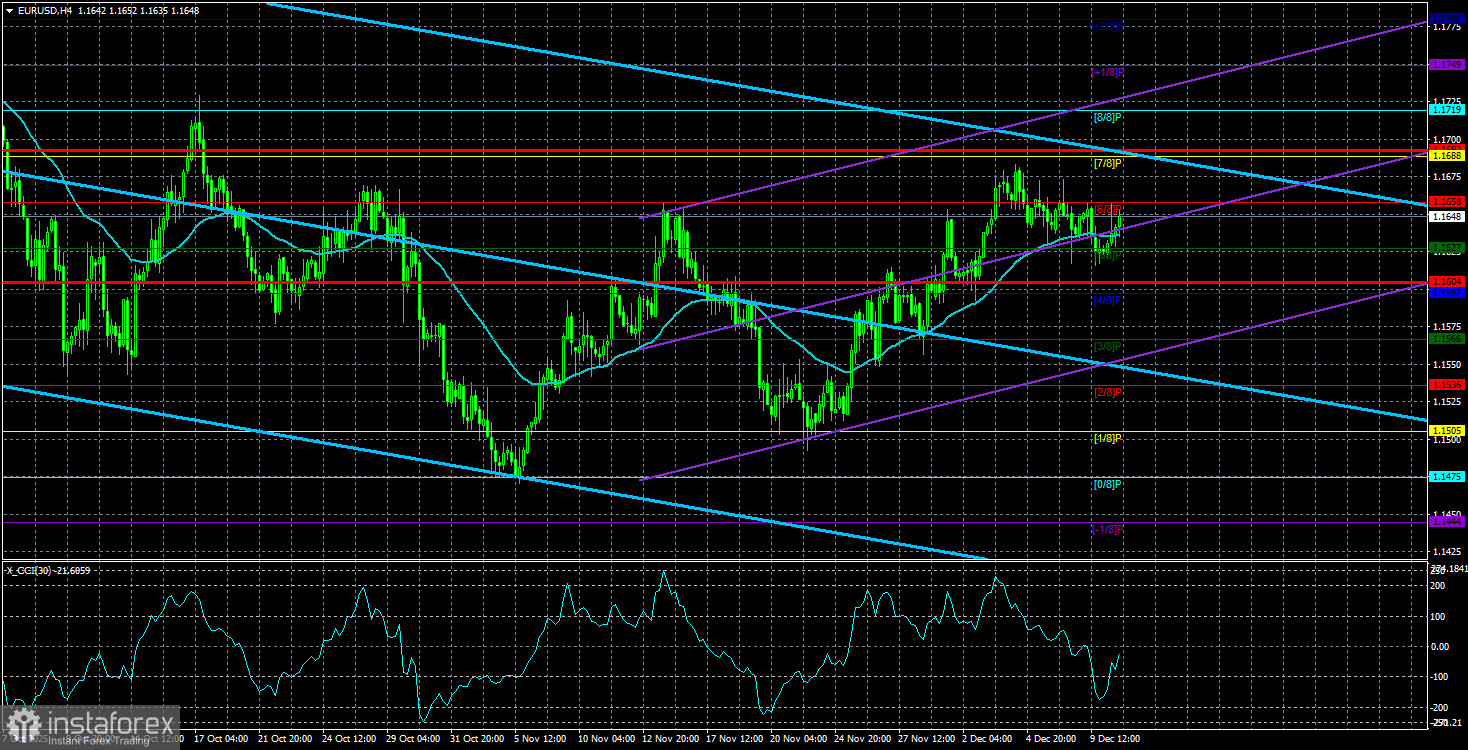
We maintain that the key element of analysis right now is the range on the daily timeframe. Given that, as of yesterday, the price was positioned right in the middle of the sideways channel at 1.1400-1.1830, the FOMC meeting had little chance of breaking the pair out of this range. Consequently, we need to wait for the consolidation to conclude.
We also believe that the fundamental backdrop for the U.S. dollar remains poor, while market makers are preparing for a new trend, which can only be upwards. Currently, major players are testing the nerves of retail traders, some of whom cannot withstand the five-month sideways range and are beginning to open random positions. Any position in the market provides liquidity, which large players often seek.
Next week, in our view, will be even more important than the current one. This week, we learned the results of the FOMC meeting and the values of the JOLTs and ADP reports. Next week, the long-awaited Non-Farm Payrolls, unemployment rate, and inflation data will be released. These are the very reports on which the Federal Reserve bases, or will base, its decisions on the key rate.
Also, let us remind you that activity in the market decreases as we approach the New Year, but given the current circumstances, how much lower can it go? The market is becoming "thin," with trading volumes falling, so any significant cash injection could trigger a new trend or the resumption of an old one. Thus, some will celebrate, while others will find good opportunities to open trades. We still expect the U.S. dollar to decline in 2026, but we reiterate that the sideways range on the daily timeframe must conclude.
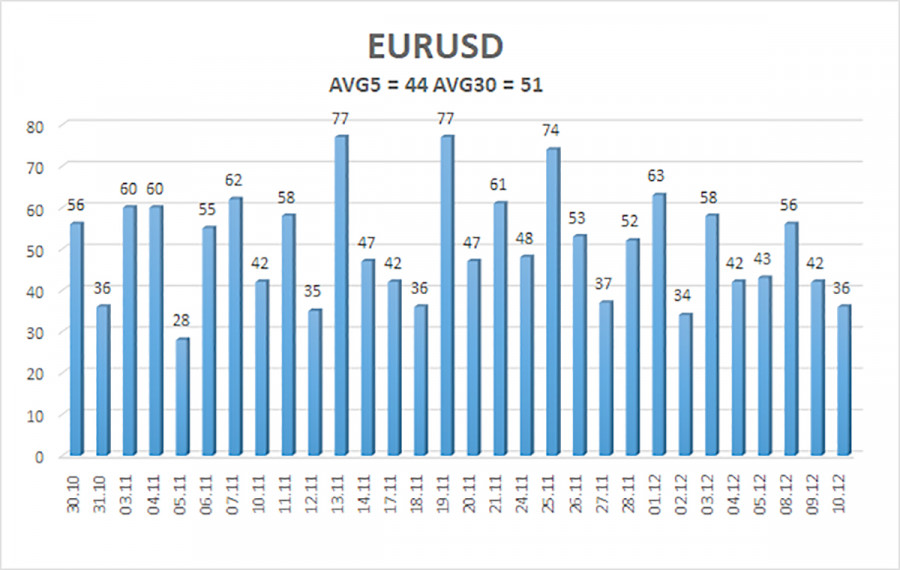
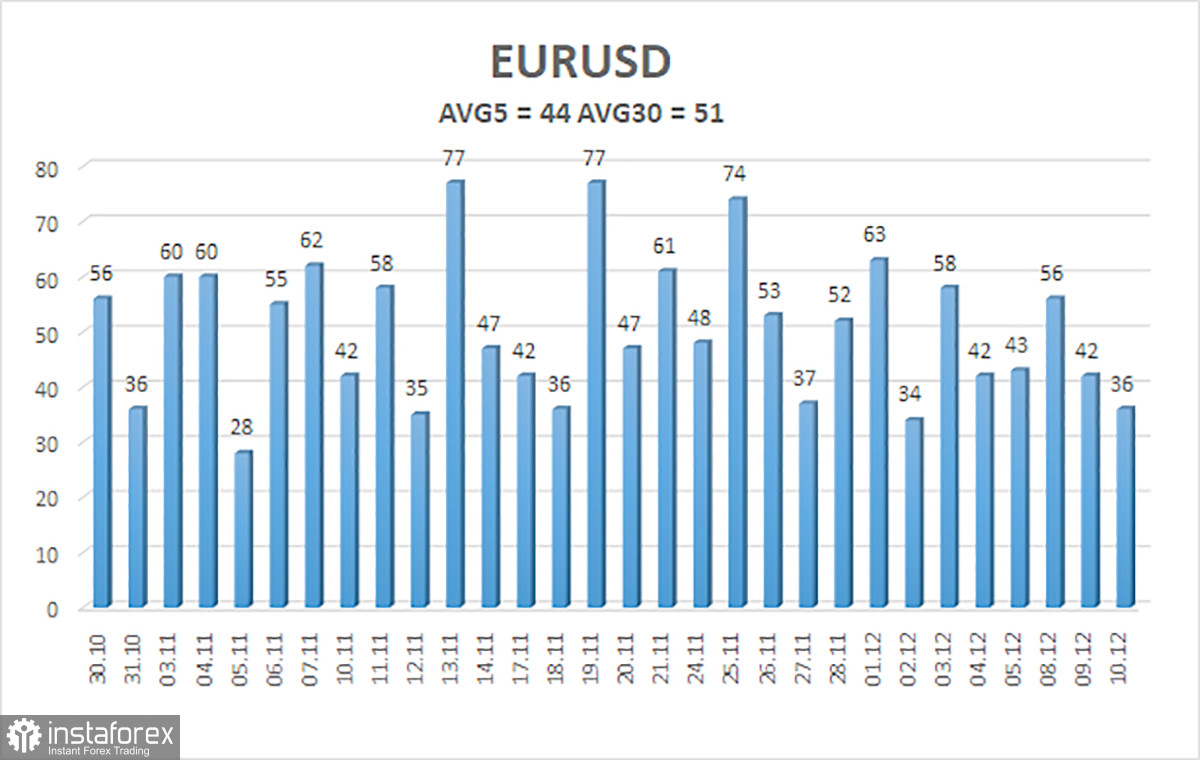
The average volatility of the EUR/USD currency pair over the last five trading days as of December 11 is 44 pips and is characterized as "low." We expect the pair to trade between 1.1604 and 1.1692 on Thursday. The upper channel of the linear regression points downward, signaling a bearish trend, but the market remains in a sideways range on the daily timeframe. The CCI indicator entered the oversold area twice in October (!!!), which could provoke a new upward trend in 2025.
Nearest Support Levels:
- S1 – 1.1627
- S2 – 1.1597
- S3 – 1.1566
Nearest Resistance Levels:
- R1 – 1.1658
- R2 – 1.1688
- R3 – 1.1719
Trading Recommendations:
The EUR/USD pair is situated above the moving average line, and the upward trend remains intact on all higher timeframes. However, a sideways range has continued for several months on the daily timeframe. The global fundamental backdrop remains critically important for the market. Recently, the dollar has often shown growth, but strictly within the confines of this sideways range. For long-term strengthening, it lacks a fundamental basis. When the price is below the moving average, small shorts can be considered with targets at 1.1604 and 1.1587 on purely technical grounds. Above the moving average line, long positions remain relevant with a target at 1.1800 (the upper line of the range on the daily timeframe).
Illustration Explanations:
- Price Levels (Support/Resistance): Thick red lines where movement may end. They are not sources of trading signals.
- Kijun-sen and Senkou Span B Lines: Strong lines of the Ichimoku indicator transferred to the hourly timeframe from the 4-hour timeframe.
- Extreme Levels: Thin red lines where the price has previously bounced. These are sources of trading signals.
- Yellow Lines: Trendlines, trend channels, and other technical patterns.
- Indicator 1 on COT Charts: Represents the net position of each trader category.